Part 1
- 請用 surf 指令來畫出下列函數的曲面圖:
$$
z=xe^{-x^2-y^2}
$$
其中 x 在 [-2, 2] 間共等切分為 21 點,y 在 [-1, 1] 間共等切分為 21 點,所以此曲面共有 21*21=441 個點。
- 請用預設的顏色對應表(Colormap)來畫出此曲面。
- 請以曲面的斜率來設定曲面的顏色。
- 請以曲面的曲率來設定曲面的顏色。
- 一個空間中的橢球可以表示成下列方程式: $$\left(\frac{x}{a}\right)^2 + \left(\frac{y}{b}\right)^2 + \left(\frac{z}{c}\right)^2 = 1 $$ 請使用任何你可以想到的方法,畫出三度空間中的一個平滑的橢球,其中 a = 3,b = 4,c = 8。(但不能使用 ellipsoid 指令。)
- MATLAB 有一些現成的指令,可以來畫出特殊立體圖形,例如,可以用 sphere 畫出圓球,用 cylinder 畫出圓柱體,用 ellipsoid 畫出橢球,請試試看。
- 請用 ez 開頭的繪圖指令(例如 ezmesh、ezsurf、ezmeshc、ezsurfc、ezplot3、ezcontour 等),畫出一個你認為最炫的立體圖形。
- (腦力激盪題)我們可用 subplot 在同一個視窗畫出兩個不同的曲面圖。你是否可想出一個聰明的辦法,讓這兩個曲面圖各自用到不同的顏色對應表?請舉例說明。
Part 2
- Holes in surfaces: How do you create a hole in a surface plot, such that you can look though the hole?
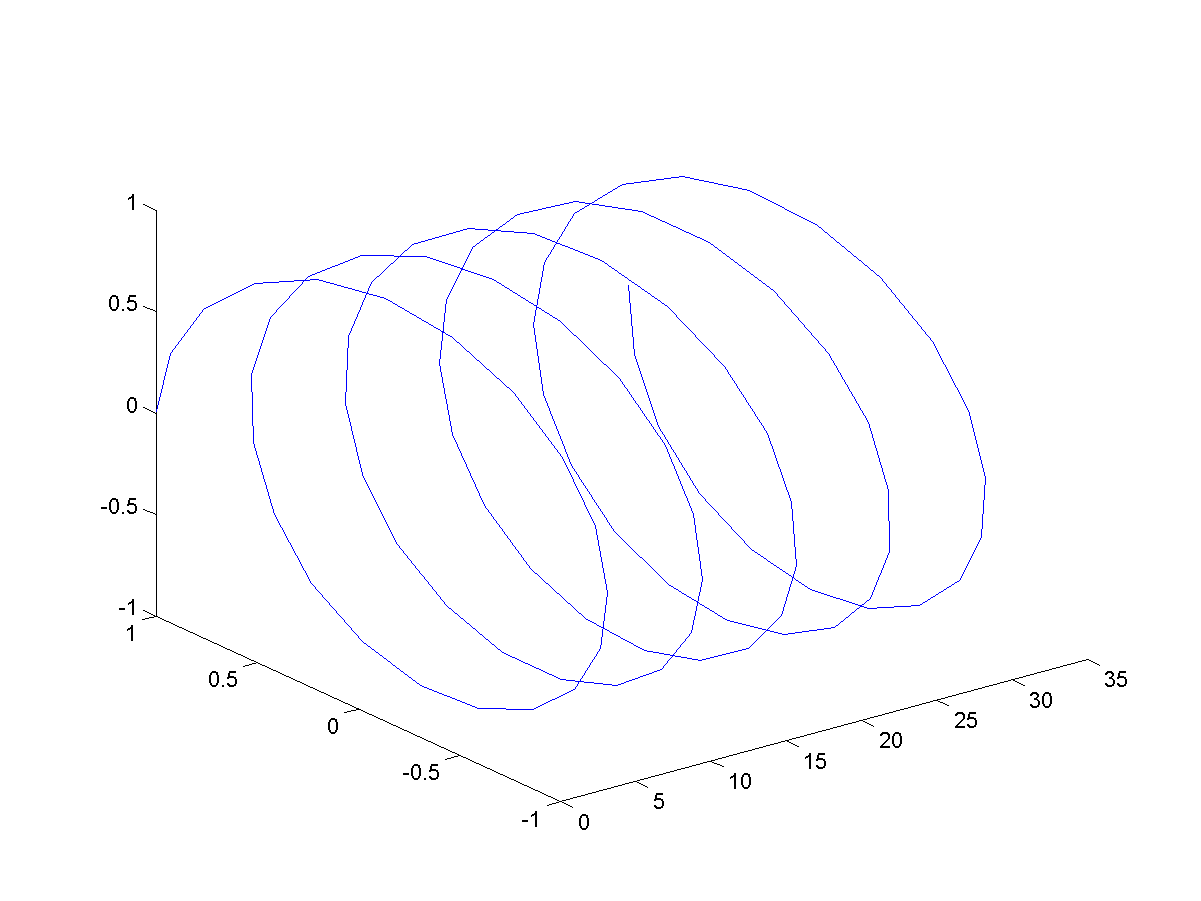
- A simple spiral in a 3D space:
Use two MATLAB statements (or less) to plot a simple spiral of radius 1 along the x-axis in a 3D space. The plot you generated should be as close as possible to the one shown next.
- Use scatter data for plotting 3D surface: What MATLAB command can use scatter data for plotting 3D surface?
- True or indexed colors:
In the following plot, we use random colors to display the peaks surface. Can you tell which one uses true color for display? And which one uses indexed color for display?
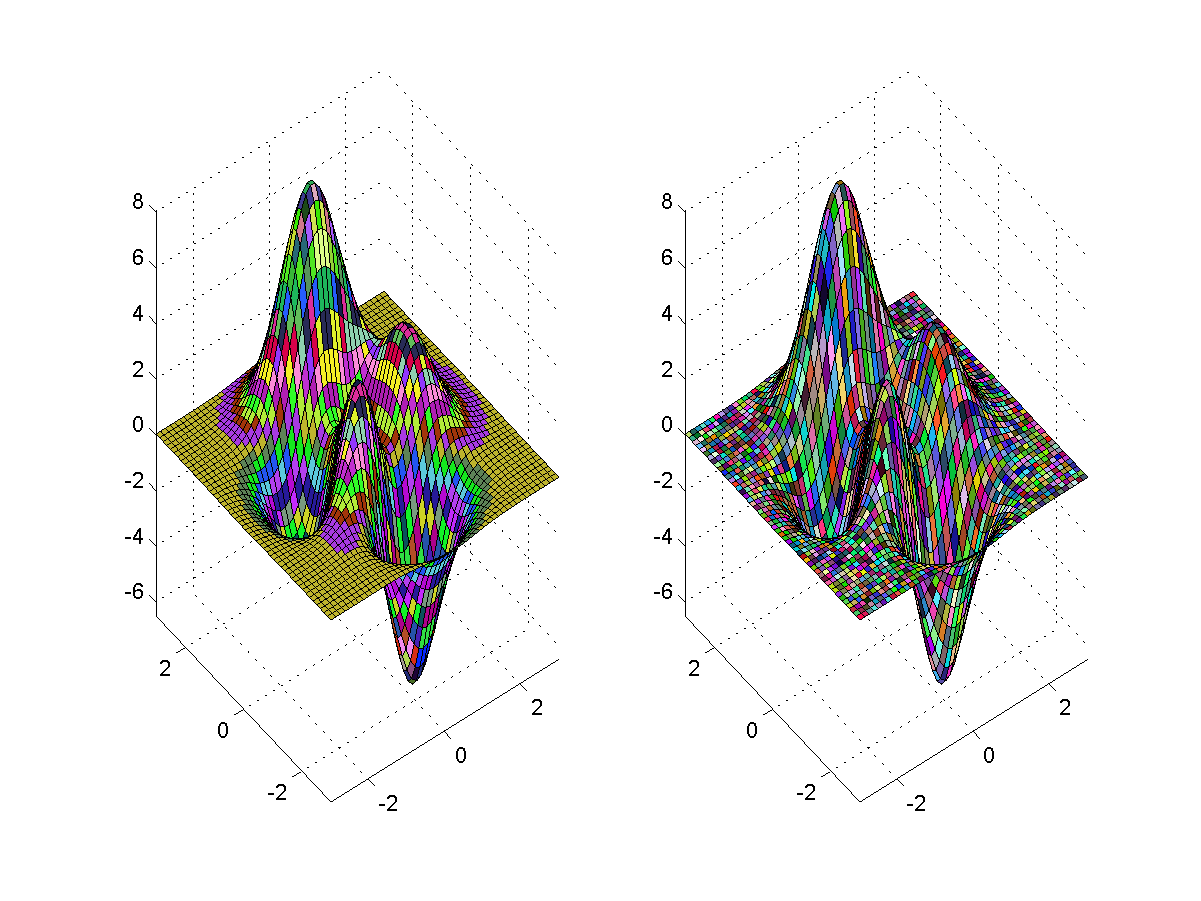
- True color and indexed color: Please explain how MATLAB determine the color of a surface using the methods of "true color" and "indexed color". Also please comment on these two methods' strength and weakness, if any.
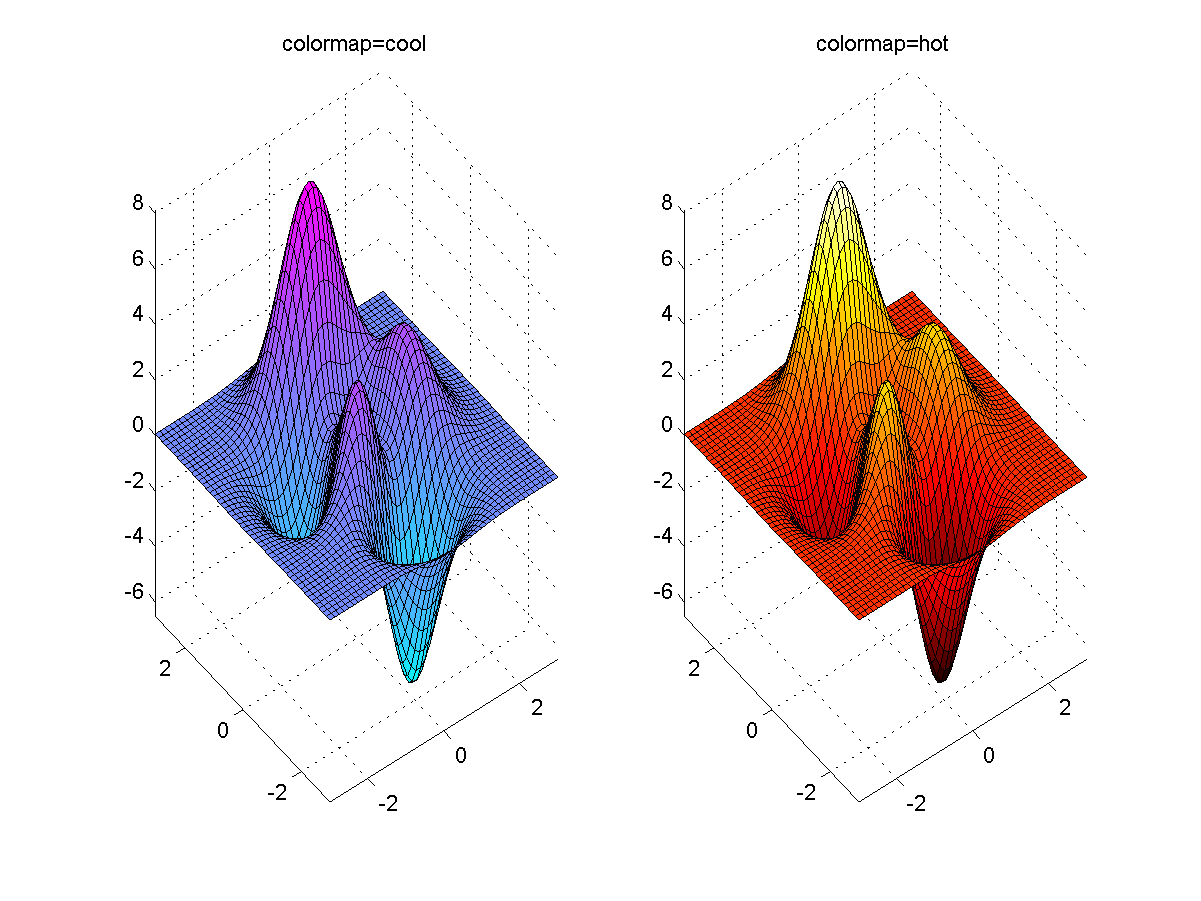
- Display two surfaces using different colormaps:
How can you display two surfaces using different colormaps (as shown next)? Write a script to verify your idea. (Hint: you need to use the command "caxis".)
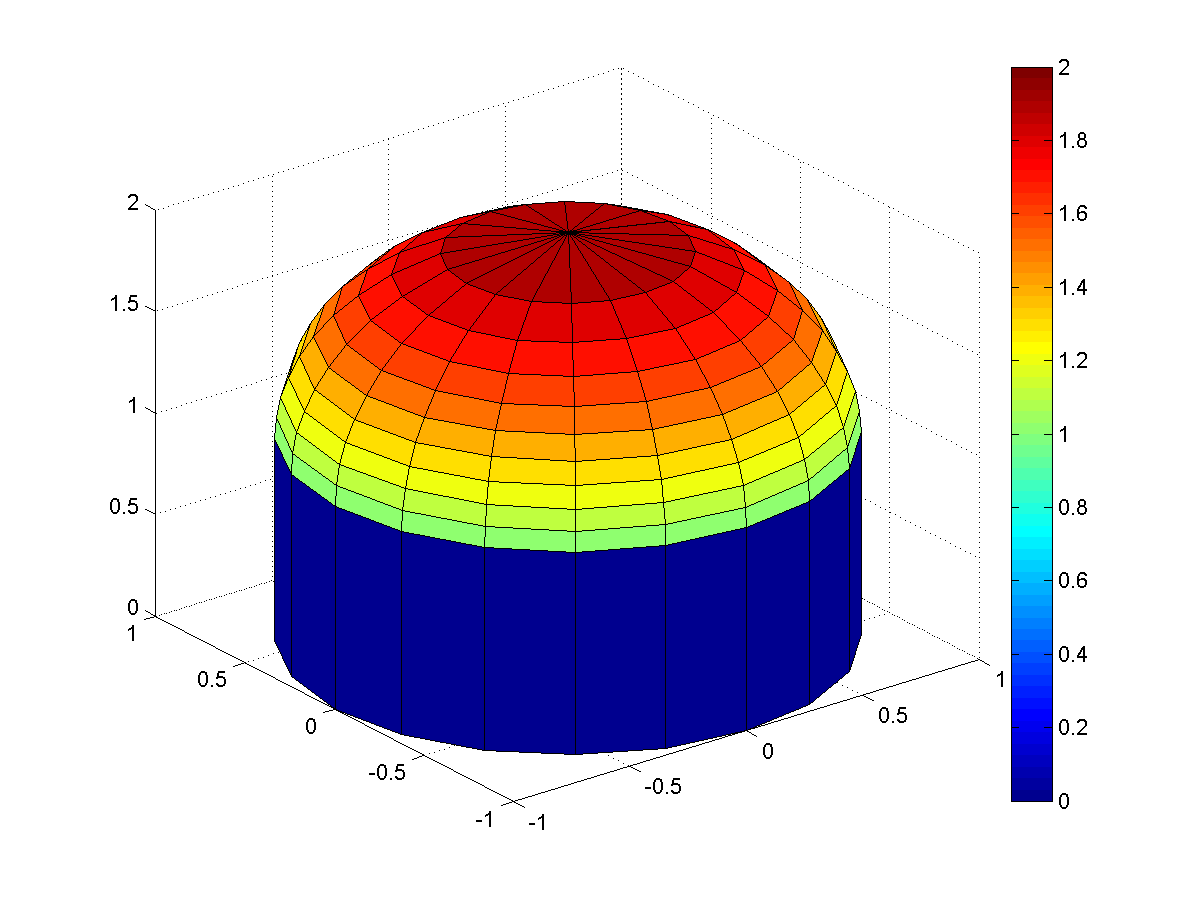
- Plot a dome:
Create a plot of dome as follows. (Hint: you need to use the commands "cylinder" and "colorbar".)
- 漣漪曲面: 請寫一段 MATLAB 程式,產生類似「漣漪」的 3D 曲面,其中內圈的同心圓震幅要大,外圈同心圓的震幅則漸漸變小。(顏色及光照可以自行調整,以增加其美觀度。)
- 同心球: 請使用 sphere 指令取得 3D 球狀資料,並畫出兩個同心球,但你必須將外球「鏤空」一部份,以顯示內球。
MATLAB程式設計:入門篇
